
From Imagery to Detection, Classification and Decision
Computer-vision models running on satellite and drone imagery automatically detect structures, vehicles, stockpiles, damage, risk and change. They catch patterns the human eye misses, at AI scale.
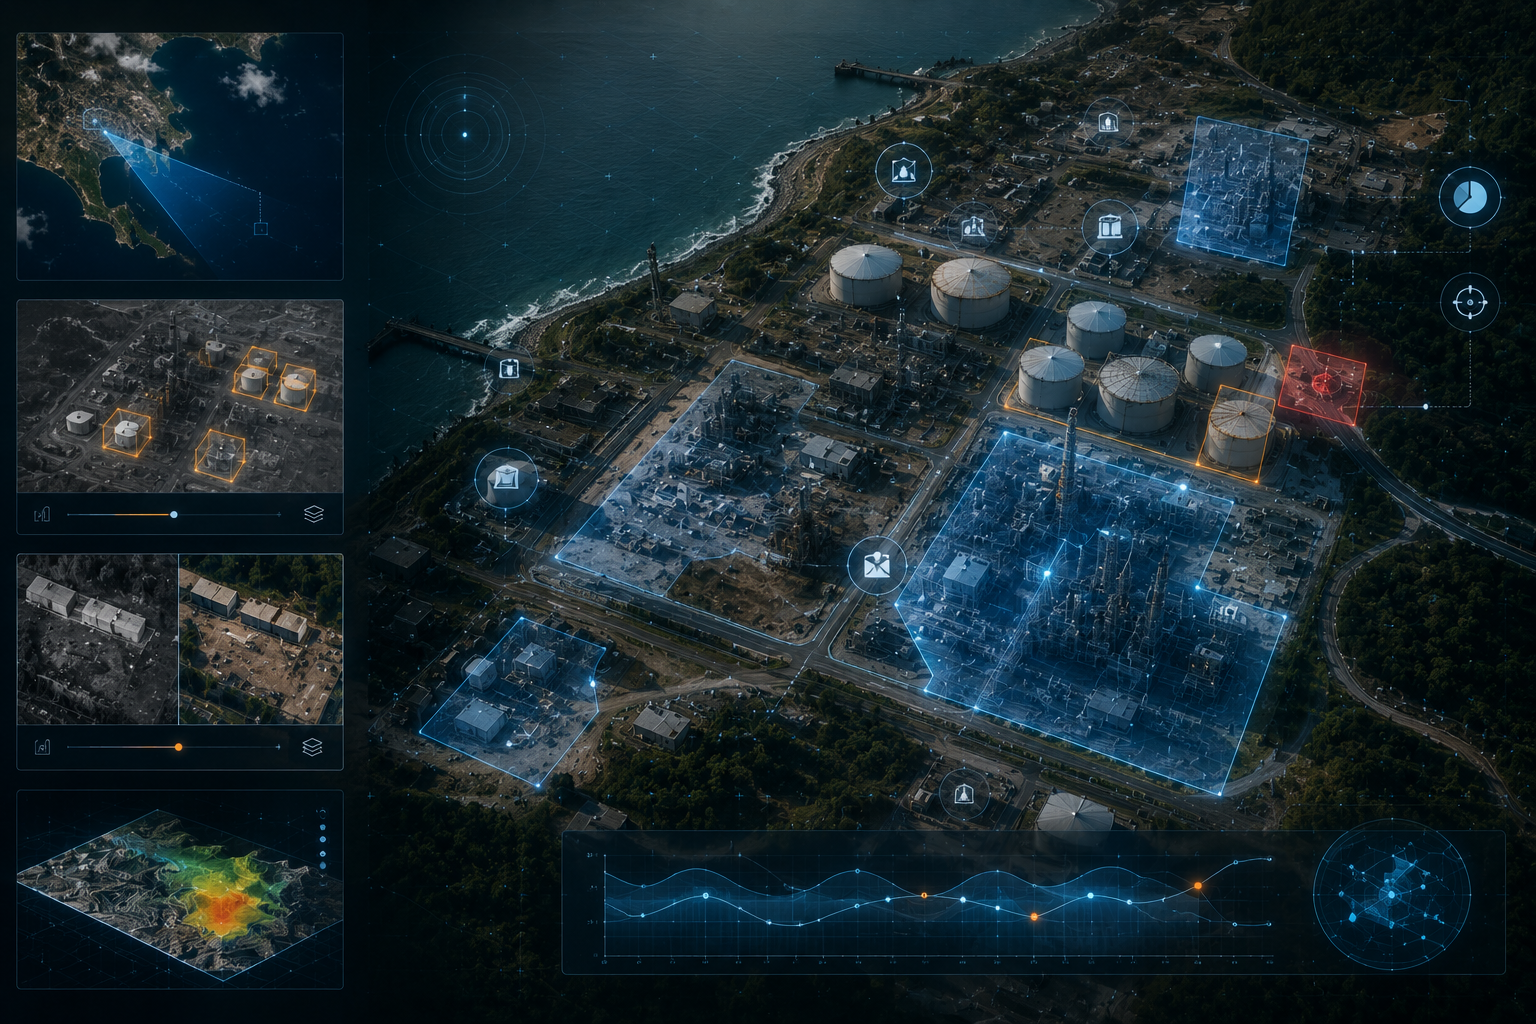 GEOAI · OBJECT & CHANGE DETECTION
From Imagery to Detection: How the Pipeline Runs
- 01 / 04
Image Acquisition
High-resolution orthophotos and multiband imagery are captured from a satellite pass or drone flight.
- 02 / 04
AI Inference
Imagery runs through trained computer-vision models; target objects are detected and classified.
- 03 / 04
Geo-Tagging
Every detection is anchored to a geographic location with GPS coordinates, a bounding box and a confidence score.
- 04 / 04
Report & Action
Detection lists, a map layer and a summary report are pushed to your dashboard or integrated system.
What Detections Does It Produce?
Each detection type is an independent module, combined per project or run on its own.
Structure & Unpermitted Build Detection
Automatic detection and classification of unpermitted or altered structures.
- +Approved zoning vs. actual structure comparison
- +New-construction start detection
- +Building-type classification
- +Parcel-level change history
Vehicle & Equipment Counting
The number and type of vehicles across a parcel, port, parking lot or construction site.
- +Vehicle type and size classification
- +Periodic count comparison
- +Density map generation
- +Anomaly and abnormal-density alerts
Stockpile & Pile Detection
The location and extent of material piles in open-air storage areas.
- +Pile boundary and area detection
- +Change-rate monitoring
- +Production / consumption trend
- +Fill ratio against capacity
Damage Classification
Damage assessment following earthquake, flood, fire or structural wear.
- +Severe / moderate / light / intact categories
- +Roof and wall integrity analysis
- +Damage-density map
- +Response-prioritization score
Change Detection
Automatic detection of differences between imagery captured at set intervals.
- +Pixel-level change analysis
- +Change percentage and area
- +Time-stamped change map
- +Automatic alert on threshold breach
Risk Map
Visual risk scoring and a priority layer generated from detection data.
- +Area-based risk score
- +Risk trend from historical data
- +High-priority zone filtering
- +Output in PDF and GIS formats
Where It's Used
Zoning & Unpermitted-Build Enforcement
A city-wide automated unpermitted-build scan once a week. Comparative analysis against the permit database, delivering a prioritized list to inspection teams.
Damage Assessment & Evacuation Planning
Classification of 3,000+ structures within 24 hours of an earthquake. Evacuation routing and response prioritization.
On-Site Stock & Vehicle Tracking
Container density at the port, equipment counts in shipyard basins and operational-capacity tracking.