Digitalize your farmland
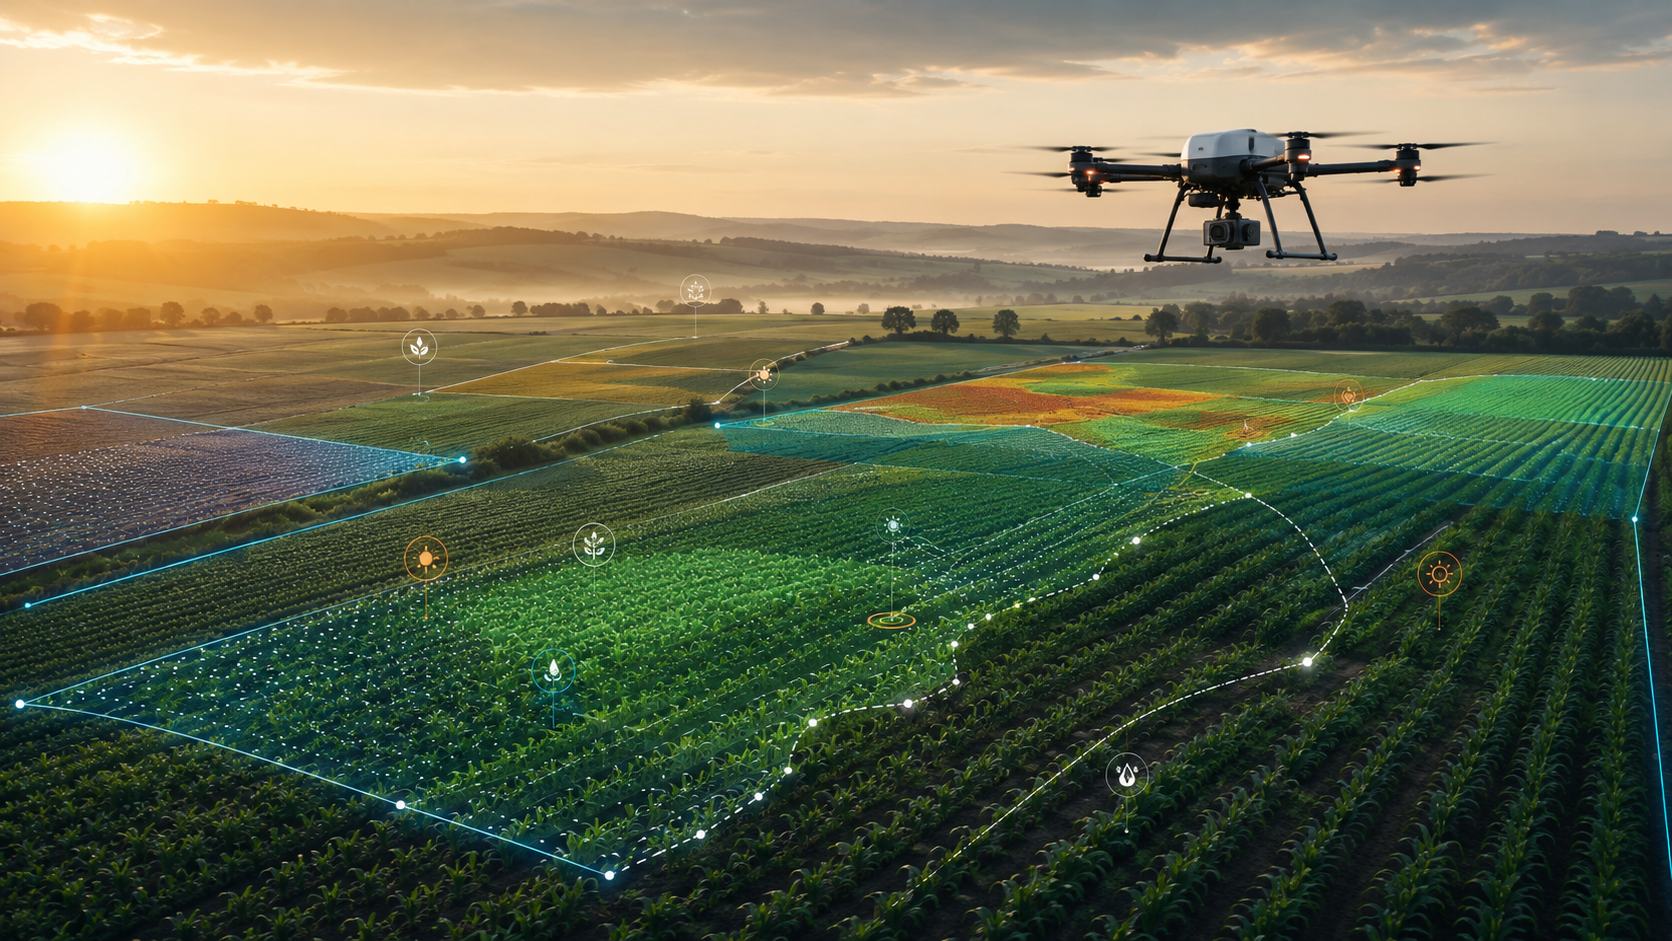
Season management at the intersection of satellite, drone and soil sensors. From NDVI analysis to irrigation decisions, from frost alerts to harvest planning — one platform, zero surprises.
3-Layer Data Intelligence
From the macro satellite view to micro soil data — every layer converges in one decision engine.
Observation Layer
Multi-layer remote sensing infrastructure
- Sentinel-2 satellite: 5m resolution, 5-day revisit
- Drone: 0.5cm pixel, site-specific detail
- IoT soil sensor: moisture, temperature, EC, pH
- Daily NDVI / NDWI / EVI index tracking
- Cloud masking + mosaic stitching
Season Management
GDD-based phenology tracking
- Sowing → Emergence → Vegetative → Flowering
- Grain Fill → Ripening → Harvest stages
- GDD (Growing Degree Days) calculation
- Phenology-based fertilizer / spray timing
- Weather-integrated risk scoring
Decision Support
AI-powered recommendations
- Irrigation timing (ETc + soil moisture)
- Fertilizer prescription (yield-map based)
- Spraying map (hot-spot detection)
- Risk & financial visibility panel
- Farmer WhatsApp alerts
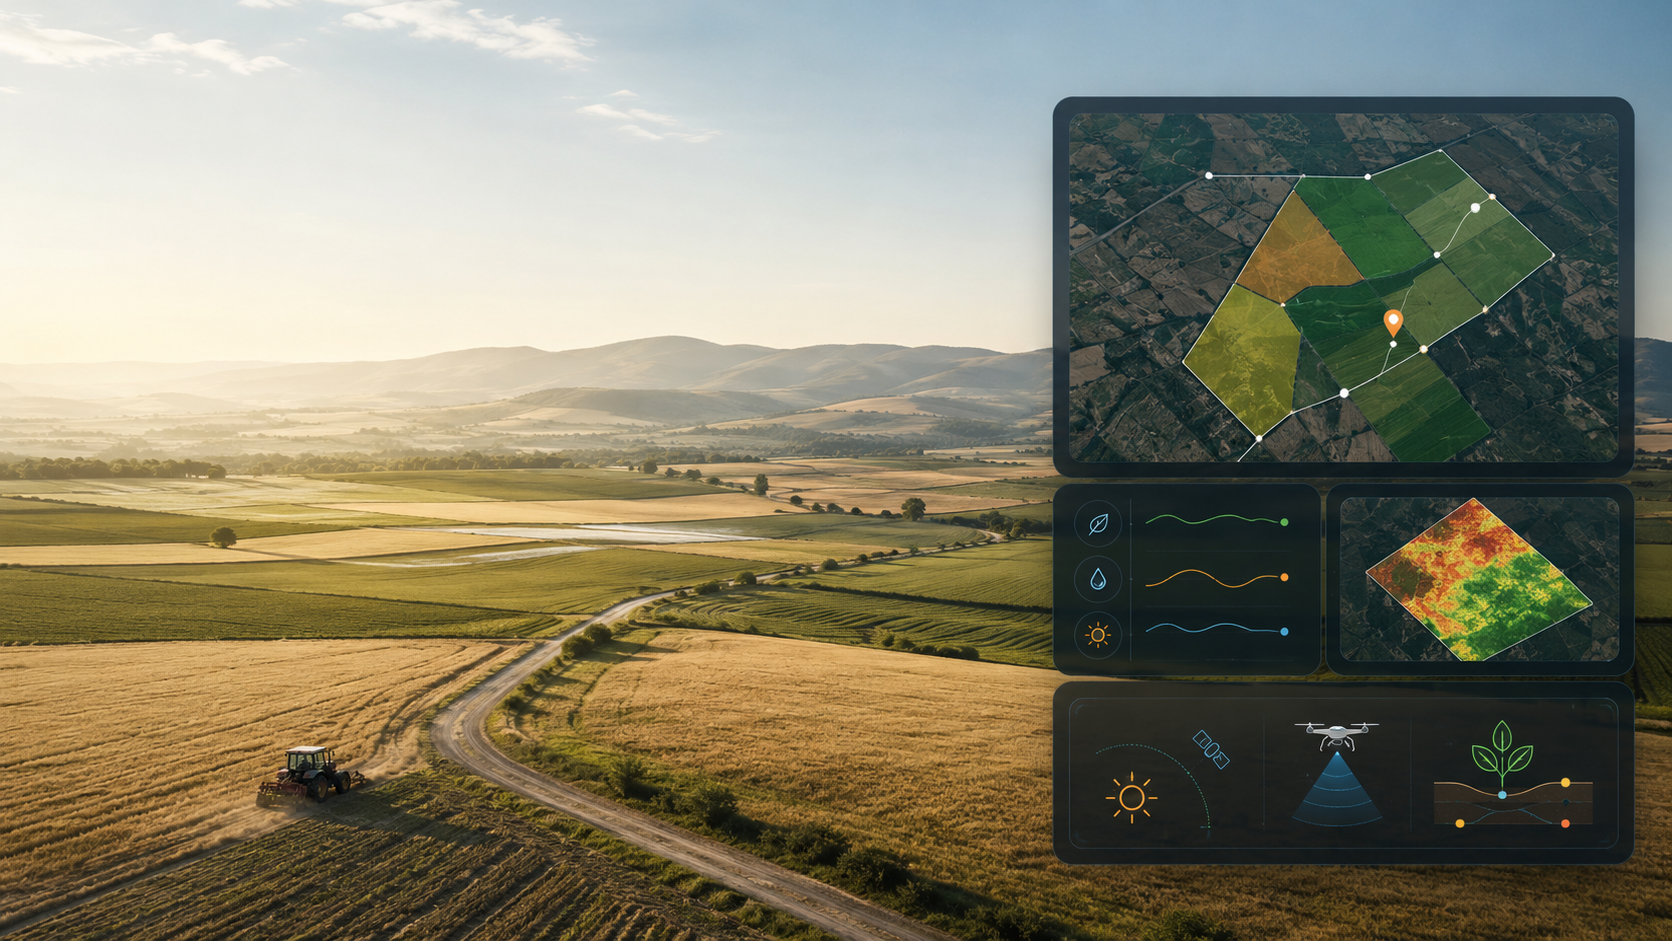 NDVI · Sentinel-2 + Drone
The field's reality, at a glance
The macro satellite view, drone-level detail and soil sensors converge on one map. Crop health, water stress and yield differences are color-coded; decisions rest on data, not guesswork.
- +Daily NDVI / NDWI / EVI index maps
- +In-parcel yield and stress differences
- +Time-stamped comparison across the season
- +Remote monitoring without going on site
GDD-Based Phenology Calendar
The right data for every stage, at the right time. With the heat-accumulation model, you know where the crop stands every single day.
Water Management
Irrigation timing from real-time comparison of ETc calculation and soil moisture. Separate recommendations for flood, drip and sprinkler systems. 30% water savings.
Yield Map
See yield variations within a parcel. Custom application prescriptions for underperforming zones — variable-rate application (VRA) support.
Input Optimization
Optimize spray and fertilizer amounts with the crop stress map. Cut unnecessary applications and invest where they pay off.
Instant Alerts —
The Right Decision at the Right Time
Instant alerts via WhatsApp, SMS or the app. Even when the farmer isn't in the field, they're notified the moment critical thresholds are crossed.
Platform DemoIrrigation Alert
Instant notification plus recommended irrigation amount when soil moisture drops below threshold.
Frost Alert
Advance warning and protection recommendations when a frost risk is detected in the forecast.
Disease / Pest Risk
Epidemic risk score from the combination of temperature, humidity and crop stress index.
Harvest Timing
Combining the GDD model and NDVI trend to signal the optimal harvest window.
See the Losses Before They Happen
Loss Projection
Projected crop loss estimates for high-damage-risk areas.
Insurance Support
Georeferenced drone imagery and damage-assessment reports speed up the insurance process.
Input Cost
Lower your seasonal cost by optimizing fertilizer, spray and water amounts.
Regional Benchmarking
Productivity benchmarking against similar parcels in the same region.
Who Uses It?
Agricultural Enterprise
Large-scale, multi-parcel grower. All land on one screen via a central dashboard.
Field Engineer
Technical staff who fly the drone and prepare reports. Data from the field via the mobile app.
Agronomy Advisor
Agronomy expert working with multiple farmers. A separate panel for each client.
Trial Plot
Control vs. test parcel comparison for spray / fertilizer efficacy trials.